
How to Review an Income Fund (ETF)
By Adam Hyde — income investing tool builder with 25 years in finance and technology.
A plain-language guide for DIY investors in the US and Canada
So you’ve found an ETF with a 12% yield and you’re wondering whether to buy it. Maybe you’ve already bought it. Either way, the same question applies: is this actually a good income fund, or does it just look good on paper?
High yield alone is not a recommendation. A fund can pay out 20% annually while slowly eroding your capital, cutting its distributions every few months, or taking on risks you didn’t sign up for. A proper review looks at the whole picture — not just the number on the label.
This guide walks through how to evaluate an income ETF the way a systematic investor would: by scoring the fund across three key areas. At the end, you can use a live review template to score any fund yourself.
Why a Structured Review Matters
DIY investors often evaluate funds based on two or three data points — yield, maybe the fund name, and a quick look at the chart. That’s understandable, but it misses a lot.
A fund paying monthly income might be doing it by returning your own capital. A fund with a great 3-year track record might have launched in a bull market and never been tested. A fund with an 18% yield might also have a 40% annualized price decline built into its history.
A structured review forces you to look at each dimension separately before forming a conclusion. It also makes funds comparable to each other, which is exactly what you need when choosing between them.
The Three Areas of a Fund Review
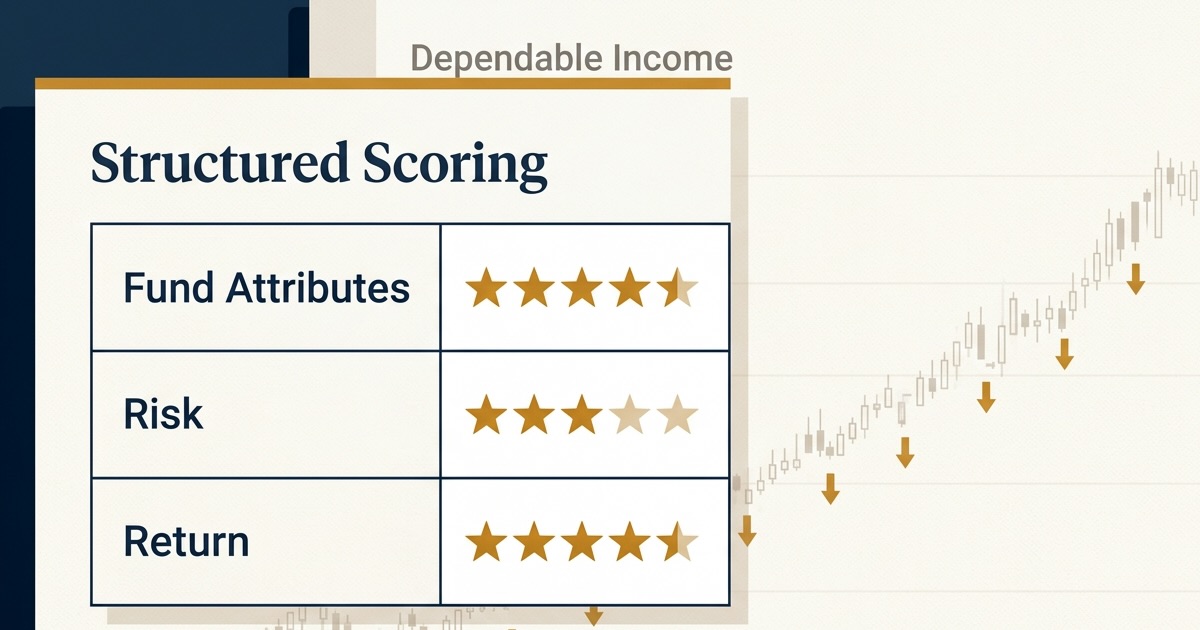
Every income fund can be evaluated across three broad areas:
- Fund Attributes — the basics: cost, age, size
- Risk — what could go wrong and how likely is it
- Return — how much income it generates and how reliably
Each area contains specific criteria. The areas can be weighted differently because not all factors matter equally to an income investor. Return and Risk matter most; Fund Attributes provide important context.
Let’s walk through each one…
Area 1: Fund Attributes
These four criteria tell you what you’re dealing with before you even look at performance.
Expense Ratio (MER) This is the annual cost of owning the fund, expressed as a percentage of your investment. On a $100,000 position, a 1% MER costs you $1,000 per year — every year, regardless of performance. For income investors, fees come directly out of your returns, but they are hidden because you don’t pay them directly. Lower is better. Under 0.25% is excellent; over 1% is a caution flag (though some complex strategies or leverage costs justify higher fees through their returns).
For Canadian ETFs specifically, always look for the Management Expense Ratio (MER) in the ETF Facts document — the product page often only shows the management fee, which is lower and doesn’t tell the full story. (We cover this in detail in Why MER Matters More Than the Management Fee.) US ETFs usually publish the MER right on their main web page for the fund.
Fund Company Size How large is the company behind this fund? A fund company managing $10 billion or more has scale, resources, and institutional credibility. A startup ETF shop managing $500 million is more likely to close a fund that doesn’t gain traction. This isn’t a dealbreaker, but it’s a real consideration — especially for smaller niche funds.
Fund History How long has this fund existed? A fund with 5+ years of history has been tested through different market conditions: rate hikes, corrections, volatility spikes. A fund launched in 2023 hasn’t been through much yet. Newer funds can still be great investments, but you should weight their short track record accordingly.
Fund AUM (Assets Under Management) How much money is actually in this fund? Larger funds are generally more liquid, more stable, and less likely to be shut down. A fund with $1 billion+ in assets has proven investor interest. A fund with $50 million is still finding its footing — and if it doesn’t grow, the fund company may close it.
Area 2: Risk
Risk is the most nuanced area and carries the highest weight in a systematic review. Five criteria are evaluated here.
Volatility / Market Sensitivity (Beta) Beta measures how much a fund’s price moves relative to the broader stock market. A beta of 1.0 means the fund moves in lockstep with the market. A beta of 1.5 means it amplifies market swings by 50% — up and down. For income investors, high volatility can be the enemy of a good night’s sleep.
But beta alone isn’t enough. Some funds have a beta near zero, which sounds stable. The reality is that some of these funds have extreme price swings that just don’t correlate with the market. Standalone volatility (how choppy the fund’s own price history is) matters just as much.
Calculating beta accurately yourself requires a long series of price data and a benchmark comparison — not something most investors will do manually. Fortunately, beta is already displayed on some fund data sites such as Morningstar, Yahoo Finance, and ETF.com. For funds in the Dependable Income App’s review library, the volatility rating has calculated it for you — no lookup required.
Sector Diversification A fund concentrated in one sector is exposed to one sector’s problems. A fund spread across five or more sectors — financials, energy, healthcare, real estate, technology, and so on — can absorb a downturn in any one area more gracefully.
This matters more than it might seem. A high-yield Canadian covered call ETF concentrated in banks might look diversified but is entirely exposed to a Canadian financial sector shock. Count the sectors with meaningful weight before assuming you’re diversified.
Geographic Diversification Similarly, country concentration is a real risk. A fund holding only US equities is 100% exposed to US market conditions, regulatory changes, politics, and economic cycles. Funds with meaningful exposure to multiple countries carry less country-specific risk.
One nuance worth noting: large-cap US companies like Apple, Microsoft, and Johnson & Johnson generate a significant portion of their revenues internationally. So a broad US large-cap fund isn’t quite as US-only as it looks.
Fund Risk Rating Both the US and Canada have standardized risk rating systems for funds. In Canada, the ETF Facts document on the fund’s website assigns every fund a risk level from Low to High. In the US, platforms like Morningstar provide a portfolio risk score. These ratings incorporate volatility, drawdown history, and other factors into a single standardized number.
This is a useful sanity check. If you think a fund is moderate risk but the official risk rating says High — that’s worth paying attention to.
Underlying Assets What does this fund actually own? The answer matters a lot for understanding income quality and stability.
A fund holding the actual stocks in the S&P 500 carries very different risk than one holding synthetic derivatives. A fund holding 30 diversified REITs behaves differently than one holding 10 individual technology stocks. Understanding what’s inside the wrapper helps you understand where the income is coming from — and how reliable it is.
Area 3: Return
This is what most investors focus on — and it’s important, but it has to be read correctly.
Yield The yield should be based on the fund’s average annualized dividend yield over its entire history — not just the number advertised on the fund page today. Why does that distinction matter? Because a fund might show a 15% yield right now, but if it paid out much less in earlier years before increasing current distributions, the long-run average tells a more honest story. Looking at the historical average helps you see past the marketing headline to what the fund has actually delivered over time.
Yield Stability Is the income consistent? A fund that has steadily grown its distributions over time is ideal. Flat but reliable payments are acceptable. Declining or erratic distributions — where you never quite know what’s coming next month — are a warning sign. Stable distributions are common in Canadian listed funds but harder to find in US listed funds so pick your funds carefully - particularly in retirement. This is one of the most important factors for retired investors. An unpredictable income stream makes household budgeting difficult and often signals a fund under stress.
The App’s performance page lets you look up yield and capital history for any reviewed fund without doing any manual calculation.
Capital History Over the fund’s lifetime, has the share price gone up, stayed flat, or eroded? A fund that pays you 15% per year but loses 10% of its share price annually is giving you back your own money. That’s called “return of your capital” and it’s not sustainable income. This is not to be confused with “Return of Capital” - a valid tax treatment that funds use. Other common terms are nav erosion, price depreciation, price decay - all bad!
A roughly flat price over time is acceptable for a pure income strategy — you’re in it for the distributions, not capital gains. Some price appreciation on top of the income is ideal. A sustained downward trend in share price, though, is a serious red flag: the fund may be paying you with your own money, which is not a sustainable strategy.
Distribution Frequency How often does the fund pay out? Weekly pays best for cash flow management and reinvestment compounding. Monthly is excellent. Quarterly is common. Annual distributions are rare for income ETFs but do exist.
More frequent payouts give you more flexibility — whether you’re living off the income or reinvesting it.
Other: Options Strategy
Many income ETFs use options — particularly covered calls — to generate additional yield above what the underlying holdings produce naturally. If the fund you’re reviewing uses options, there are two additional factors worth considering: how the strategy is constructed (in-the-money vs. out-of-the-money options), and options coverage — how much of the portfolio the fund is writing the options on.
On construction: out-of-the-money covered calls let the underlying holdings appreciate more before the options kick in, preserving more upside potential for unitholders. In-the-money calls generate more premium income but cap price gains more aggressively. On coverage: a fund writing calls on 100% of its portfolio is giving up way more upside than one writing on 50%. Neither approach is automatically better — it depends on what the fund company is optimizing for — but it’s worth understanding what you own.
Ultimately, the proof is in the pudding. A well-constructed options strategy should show up in the numbers over time: competitive total returns, stable distributions, and a share price that doesn’t quietly erode. If the yield looks great but the capital history is a slow bleed, the options strategy may be generating income at the expense of the underlying fund value. Not all fund managers are equal, many have flawed options strategies that don’t hold up well in a variety of market conditions.
Putting It Together: The Score
You can use the Fund Report Card template to rate any fund yourself. It walks through each criterion and calculates the weighted score automatically.
Each criterion gets a 1–5 rating. Those ratings are combined within each section, and the sections are weighted by importance, producing a final composite score. You can modify section and individual criterion weights if you don’t agree with the default values.
The Fund Report Card calculates a total score and a Dependability Score — a separate weighted composite of the six factors that matter most to retirement income investors: Yield Stability, Yield, Volatility, Capital History, Fund Risk, and Underlying Assets. Where the full report card gives you a complete picture of a fund, the Dependability Score cuts straight to the question retired investors care about most: can I depend on this fund to pay me reliably? A Dependability Score above 67% indicates a fund that has demonstrated consistent, reliable income delivery over its history.
The Fund Report Card lets you compare very different funds on the same scale. A Canadian bank covered-call ETF versus a US high-yield bond fund, for example. You can see which one holds up better across all dimensions — not just yield.
For a full breakdown of every criterion, category weights, and the letter grade scale, see our scoring methodology.
Already Reviewed: Skip the Research
Doing a full review from scratch takes a lot of time. You need to dig into fund documents, find the MER, look up distribution history, check the risk rating, and understand what the fund actually holds.
That’s why the Dependable Income Investing App maintains a library of completed reviews — over one hundred US and Canadian income ETFs already scored and updated. You get the full breakdown for each fund: all 13 criteria rated, notes explaining each score, and a performance page where you can check yield history and capital trends for any fund in the library. In the Review Funds section of the App, you can put up to three funds side-by-side for the Coles Notes of how they compare, a bit like reviews you might have seen at Consumer Reports. Note: Funds must have existed for at least a year to be reviewed in the App - so there is a decent history for performance data.
Browse the complete list of reviewed funds at dependableincomeinvesting.com/reviews and find out how your current holdings actually score — or discover funds you haven’t considered yet.
FAQ
Q: What is the most important factor when reviewing an income ETF?
A: Yield Stability — how consistent and predictable the distributions are over time. A fund that pays reliably every month, even if the yield is modest, is far more useful to a retiree than one with a high headline yield that fluctuates wildly or trends downward. The actual Yield amount and Volatility are close seconds.
Q: Is a high yield always a red flag?
A: Not automatically, but it warrants scrutiny. Yields above 12–15% are sometimes funded partly by return of capital — meaning the fund is paying you back your own money rather than generating true income. Always check the capital history alongside the yield. A high yield paired with a flat or rising share price is a very different story from one paired with a steadily declining Net Asset Value (NAV).
Q: What is NAV erosion and why does it matter?
A: NAV (Net Asset Value) erosion means the fund’s unit price is declining over time. If a fund pays you 14% annually but its share price falls 8% per year, your real income is closer to 6% — and your capital is shrinking. Over a 10-year retirement, that compounding loss can significantly reduce the value of your portfolio. Always check a fund’s price history over at least 3–5 years, not just its current yield.
Q: What’s the difference between Management Fee and MER?
A: The Management Fee is what the fund manager charges for running the fund. The MER (Management Expense Ratio) includes the management fee plus all other operating costs — leverage costs, trading fees, administrative expenses, and applicable taxes. The MER is always higher and is the true cost of ownership. Canadian fund pages often display only the management fee, which can be misleadingly low. In Canada, always find the MER in the ETF Facts document.
Q: How do I evaluate a covered call ETF specifically?
A: In addition to the standard review criteria, check two things: the options coverage ratio (what percentage of the portfolio has calls written against it — lower means more upside participation) and whether the fund uses in-the-money or out-of-the-money calls (OTM preserves more upside). Then validate the strategy in the numbers: if total return is competitive and the share price is stable over several years, the strategy is working. If the yield is high but the NAV is slowly declining, the options income is partly coming at the expense of your capital.
Q: How many years of history should a fund have before I consider buying it?
A: At least 1 year is a reasonable minimum, and 3+ years is preferable. A fund launched in 2022 or later has only seen one type of market environment. You want to see how a fund behaves through a variety of conditions — rate hikes, equity corrections, volatility spikes. The Dependable Income Investing App only reviews funds with at least one year of history, and flags newer funds explicitly.
Q: Where can I find pre-scored fund reviews without doing the research myself?
A: The Dependable Income Investing App maintains a library of over 100 US and Canadian income ETFs, each scored across 13 criteria with a Dependability Score. You can browse them at dependableincomeinvesting.com/reviews or compare up to three funds side-by-side inside the App.
Try Dependable Income Investing free
Use the Fund Report Card to score any income ETF yourself — or browse 100+ pre-scored fund reviews in the app.
Investing involves risk. This article is for educational purposes and does not constitute financial advice.